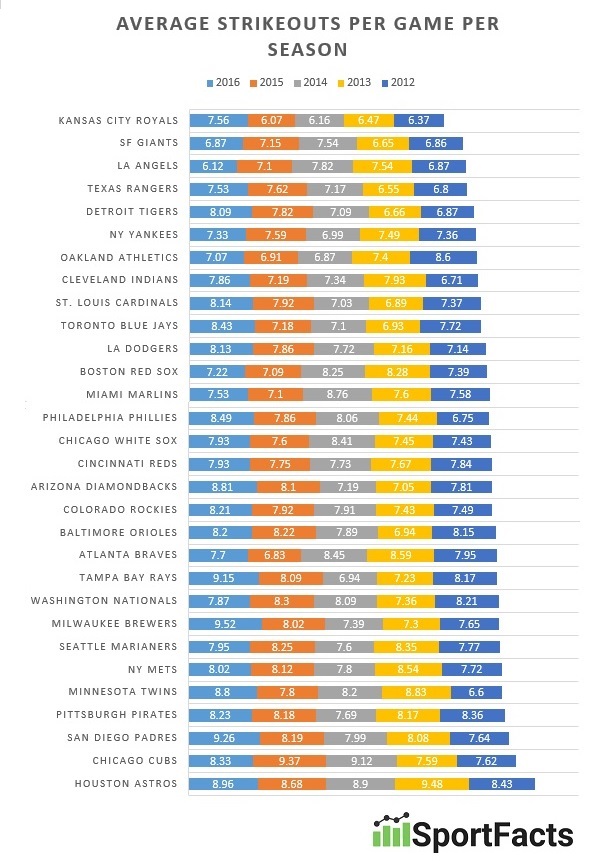
For some teams, it’s part of the strategy, take a lot of swings, don’t worry too much about striking out, the resulting hits will balance everything out. Others, they just don’t have the power to really take successful cracks at the ball.
We wanted to see what teams average the most strikeouts on offense per game, so we pulled data on the past five seasons (2012-2016) to determine who ended up walking back to the dugout empty-handed the most. Below you will find a breakdown of average strikeouts per team over the last five seasons, and a chart below that shows the five year average of every team as well.
It’s an interesting mix, with the Giants and Royals, who have been very successful the past few years, having very low strikeout averages, which makes sense. But then the Chicago Cubs, having the second worst average, still won the World Series last season.
Get the full scoop below:

Average over the past five years:
| Team | Average Strikeouts Per Game |
| Houston Astros | 8.89 |
| Chicago Cubs | 8.406 |
| San Diego Padres | 8.232 |
| Pittsburgh Pirates | 8.126 |
| Minnesota Twins | 8.046 |
| NY Mets | 8.04 |
| Seattle Mariners | 7.984 |
| Milwaukee Brewers | 7.976 |
| Washington Nationals | 7.966 |
| Tampa Bay Rays | 7.916 |
| Atlanta Braves | 7.904 |
| Baltimore Orioles | 7.88 |
| Colorado Rockies | 7.792 |
| Arizona Diamondbacks | 7.792 |
| Cincinnati Reds | 7.784 |
| Chicago White Sox | 7.764 |
| Philadelphia Phillies | 7.72 |
| Miami Marlins | 7.714 |
| Boston Red Sox | 7.646 |
| LA Dodgers | 7.602 |
| Toronto Blue Jays | 7.472 |
| St. Louis Cardinals | 7.47 |
| Cleveland Indians | 7.406 |
| Oakland Athletics | 7.37 |
| NY Yankees | 7.352 |
| Detroit Tigers | 7.306 |
| Texas Rangers | 7.134 |
| LA Angels | 7.09 |
| SF Giants | 7.014 |
| Kansas City Royals | 6.526 |
